Case study 04Quant
Order-book spoofing-pattern detector
Detector for a pattern consistent with spoofing on a crypto perpetual: over 14 h, about 97% of 4,961 large placements were cancelled essentially unfilled.
The problem
Traders watching a perpetual on a crypto derivatives venue kept seeing large orders flash at the best price for about a second while open interest seemed to jump. They wanted to know if this was real and what it looked like. Public depth carries no order IDs, so every placement and removal has to be inferred from quantity changes.
What I built
In two days in June 2026:
- a venue-agnostic collector that writes the L2 book (top 10 levels of a 100 ms depth stream, arriving every 100–200 ms), trades and open interest to an append-only Parquet store;
- a deterministic analyzer that rebuilds large top-of-book placements, labels how each ended, and writes reports and an hourly digest for traders;
- a real-time monitor that raises started, escalated and ended alerts, tested by replay;
- a findings log with the method behind every number.
I packaged it as four Docker Compose services. Collection and the hourly digest ran overnight on a server, and 35 automated tests pass.
How it works
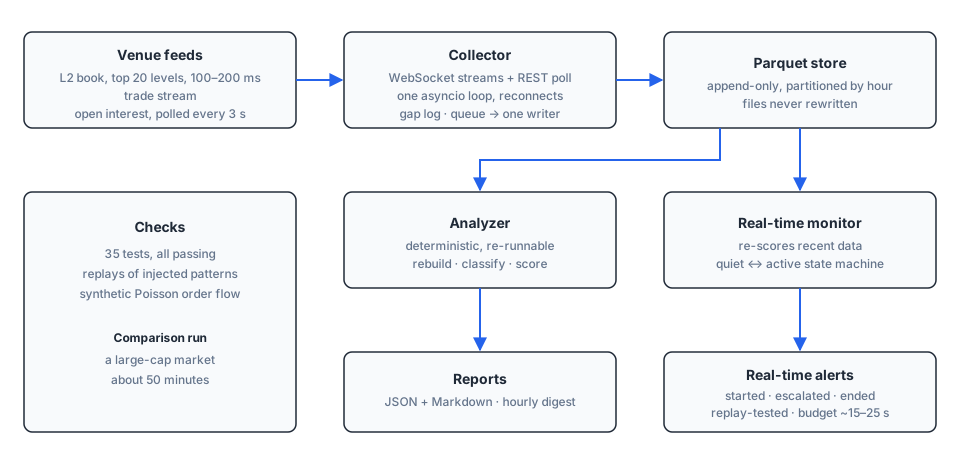
- Reconstruction. A placement is a large quantity jump at the best price. The analyzer follows that price until the added quantity is gone, then labels it cancelled, filled or partly filled from the trade tape. Events overlapping a feed gap are dropped, not guessed.
- Calibration. Thresholds come from the market’s own baseline and enter the config by hand, so a running detector never changes silently.
- Score and monitor. An explainable score shows each component next to the total. The monitor re-scores recent data through a quiet/active state machine with confirmation and cooldowns; its typical latency budget is 15–25 s from pattern to alert.
Results
- Figure
- 14 hovernight capture: 275,052 book snapshots, 32,871 trades and 16,704 open-interest samples
- Figure
- 4,961large top-of-book placements rebuilt; about 97% cancelled essentially unfilled
- Figure
- 0.39–0.41 smedian lifetime of a large placement (bid side, ask side)
- Figure
- 69% vs 13%of open-interest change within ±60 s of a 15-minute grid, against an even spread
A 14-hour overnight capture of one market in June 2026, no significance tests: 275,052 book snapshots, 32,871 trades, 16,704 open-interest samples.
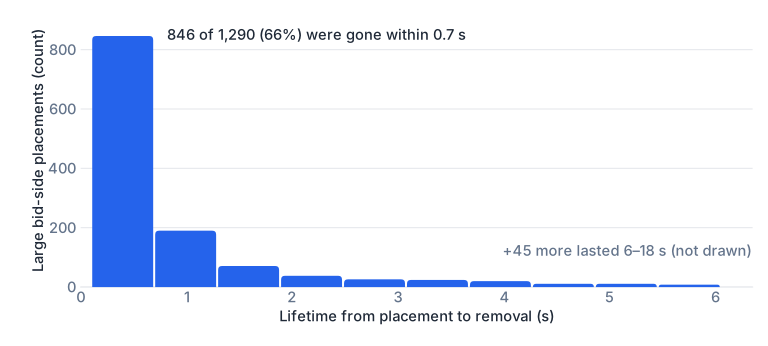
- The pattern. 1,290 bid-side and 3,671 ask-side large placements: about 97% cancelled essentially unfilled, about 85% gone within 2 s, median lifetime 0.39 s (bid) and 0.41 s (ask). This is a pattern consistent with spoofing; the data cannot show who placed the orders.
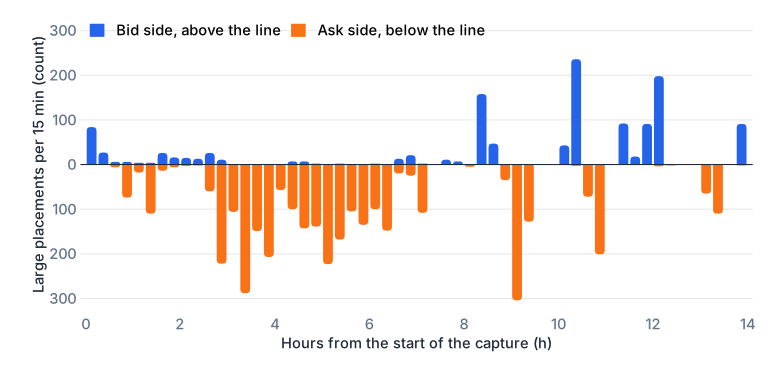
- Two sides, shared sizes. 87.5% of active 15-minute buckets were dominated by one side, with 12 switches overnight. The same exact sizes recurred on both sides; one size alone came up in 1,355 short-lived ask-side placements and 95 bid-side ones.
- A data artifact, found and fixed. The venue’s open-interest timestamp refreshed only about every 15 minutes (57 distinct stamps for 1,465 value changes), which had made one score component meaningless; the series was re-keyed to receive time. Of all open-interest change, 69% fell within ±60 s of a 15-minute grid (13% for an even spread), with no matching trade burst: the “spikes” look like batched, delayed prints.
- What open interest tracked. Over 55 grid-aligned quarter hours, open-interest change tracked volume (correlation +0.89) and net aggressor flow (−0.82); clock-aligned intervals give +0.52 and −0.29. Open interest tended to grow when aggressive sellers hit the bids, and shortly after bid-side placements it mostly fell (715 falls, 181 rises, of 1,202).
- A rejected hypothesis. Were large asks paired with small bids? A small bid appeared within seconds of 20.0% of large asks, against 26.0% at baseline, so not confirmed.
- Tests and a comparison run. The tests recover injected patterns exactly and score synthetic Poisson flow low. In a separate 50-minute run on a large-cap market, fast cancellation was just as common but exact sizes almost never repeated, though its finer lot sizes make exact repeats rarer anyway. The composite score alone did not separate the two markets.
What I learned
- Check the clock before the signal. A stale exchange timestamp silently broke one score component; the open-interest “spikes” appear to be batched prints.
- Calibration needs judgment. One automatically suggested threshold would have cut the reported one-second pattern out of its own statistics; it was overridden and the reason recorded.
- Test the story you are given. Neither paired orders nor an open-interest push showed up; instead, activity alternated between the sides hour by hour.
Notes
Research only; not investment advice.